
On Friday, October 30, Pakistan published two inflation numbers that look like they disagree. The Pakistan Bureau of Statistics put weekly essentials inflation at 11.32 percent, while the Finance Division projected October inflation at 9.5 to 10.5 percent. Both are true, because they measure different things: the weekly basket shows what the market did this week, while the monthly projection shows where the whole economy is heading.
Two gauges, two different baskets
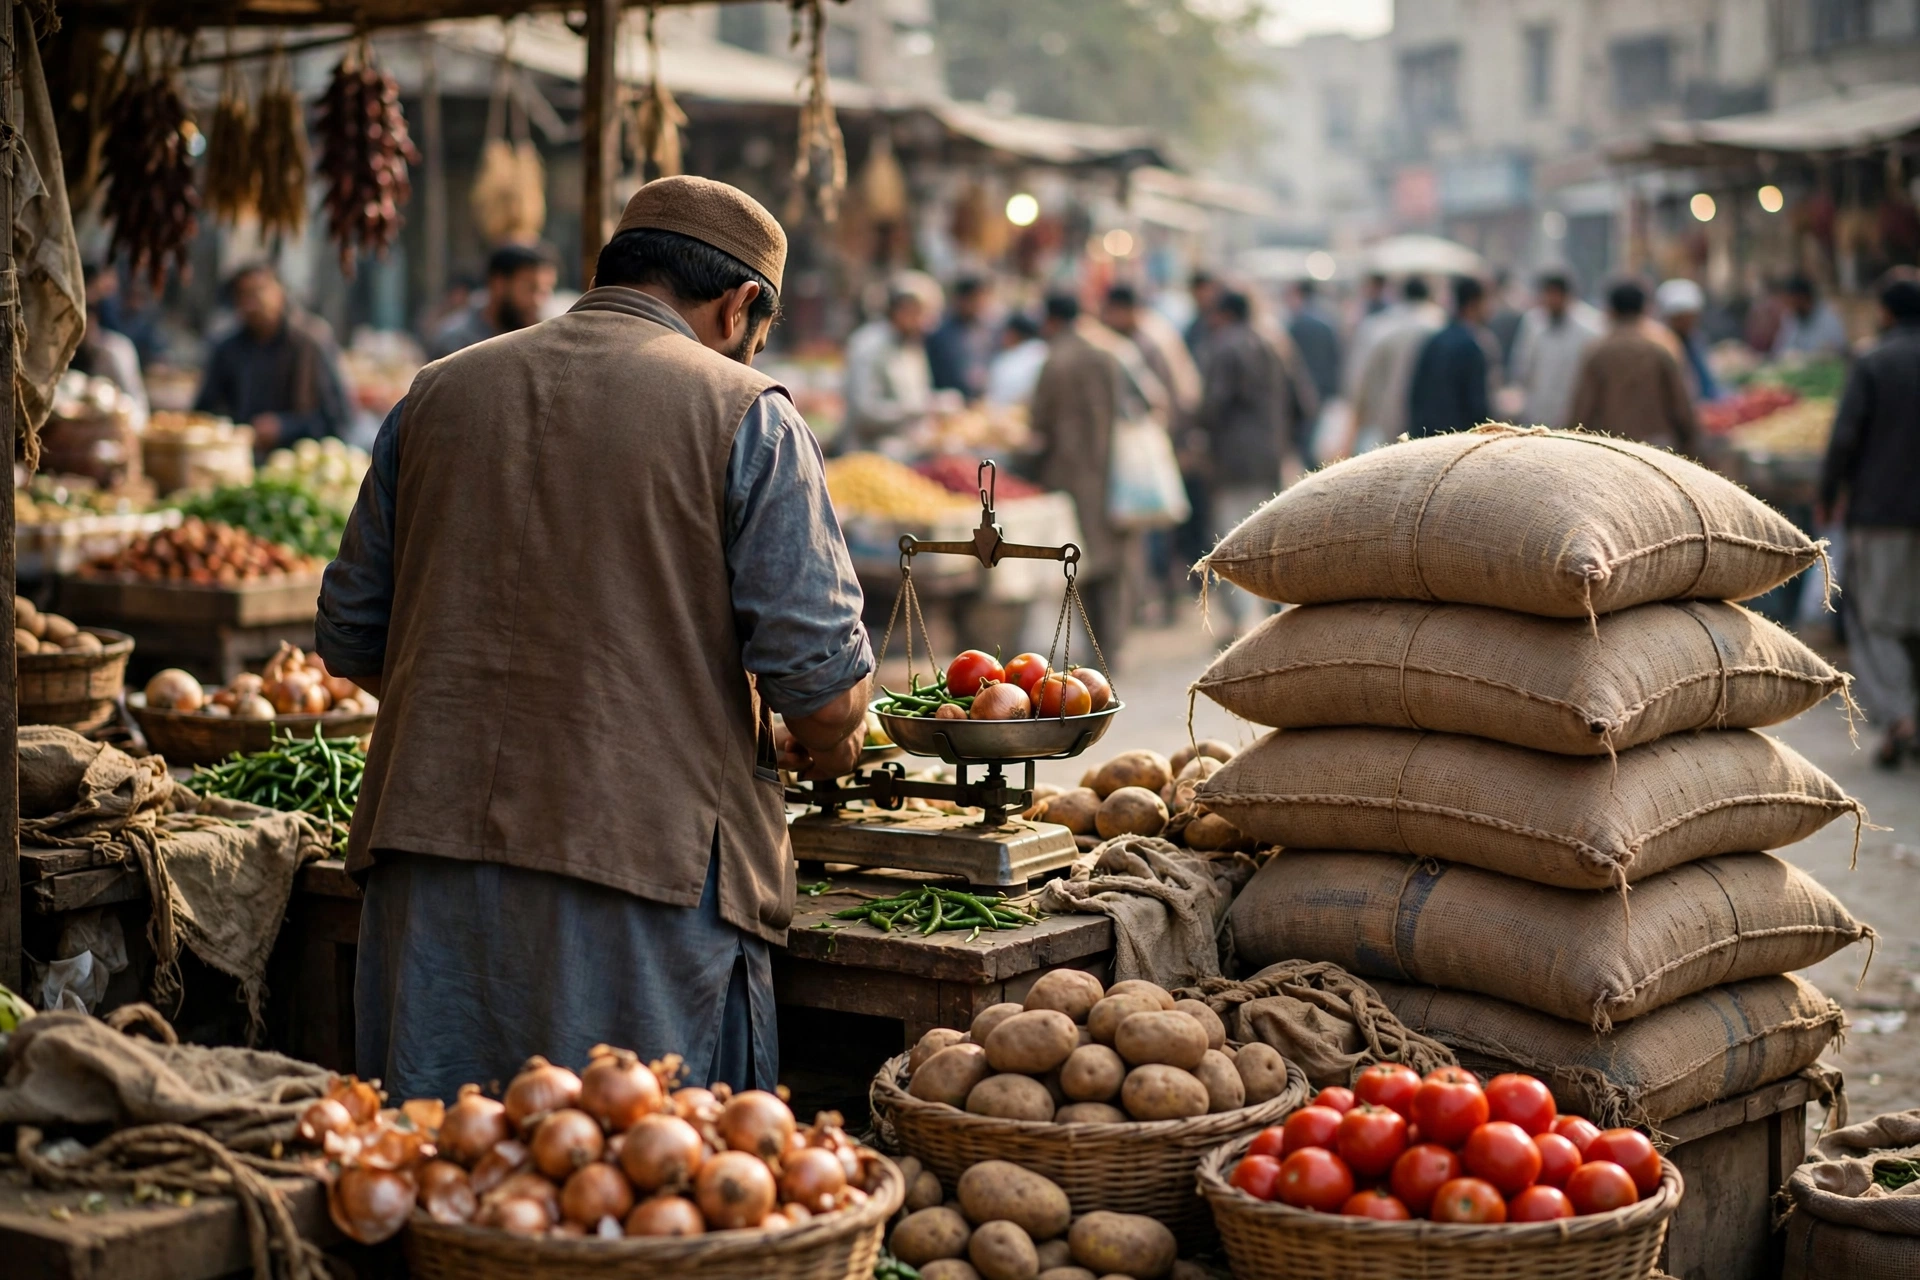
The weekly number comes from the Sensitive Price Indicator, which tracks 51 essential items from 50 markets in 17 cities. For the week ended October 29, the combined index stood at 373.51 on a 2015-16 base of 100. It fell 0.35 percent on the previous week, with prices rising for 15 items, falling for 12 and steady for 24. Year on year, the same basket costs 11.32 percent more than in the same week last year.
The monthly number is a different animal. The Consumer Price Index covers a far wider basket, including services and housing costs the weekly gauge never touches, and it is published once a month. The Finance Division figure is not a measurement: it is a projection for October, published before the bureau releases the actual October CPI in early November. Comparing the two directly is a category error, but reading them together is exactly how a household should use them.
The energy ladder behind the 11.32 percent
The year-on-year ladder is led, by a wide margin, by energy. LPG is up 106.86 percent on a year earlier, more than doubling. Electricity charges for the first consumption quintile are up 52.38 percent, diesel 45.13 percent, petrol 43.61 percent, wheat flour 34.87 percent, chicken 31.72 percent, chilies powder 15.55 percent, mutton 14.66 percent, plain bread 12.26 percent, beef 12.10 percent, onions 8.99 percent and prepared tea 8.41 percent.
That ladder explains why the weekly number feels worse than the monthly projection: fuel and power costs feed into transport, milling, cold storage and cooking. The same week saw diesel crossing Rs400 a litre on October 30, while LPG at a record Rs600 a kilo is squeezing kitchens that switched away from piped gas. The week-on-week falls soften the picture only slightly: electricity charges for the first quintile fell 3.92 percent, chicken 2.95 percent, eggs 2.81 percent, wheat flour 0.83 percent and LPG 0.73 percent.
Who feels it most
The release also breaks the annual rate down by spending group, and the split cuts against the usual assumption. The lowest group faced 8.07 percent, the second quintile 9.92 percent, the third 8.95 percent, the fourth 9.51 percent, and the highest group 12.13 percent. The richest households show the highest rate because their basket carries more of the energy items that rose fastest.
That does not mean poorer households are better off: an 8.07 percent rise still bites hardest where food and fuel take the largest share of income. The honest reading is that no group escaped: the range runs from 8.07 to 12.13 percent, and the combined 11.32 percent sits near the top of it.
What the Finance Division expects, and what it fears
The wider context helps explain the projection. Headline CPI eased to 10.3 percent in September from 11.1 percent in August, taking the July to September average to 10.2 percent versus 4.3 percent a year earlier. Transport rose 27.4 percent year on year, housing, water, electricity, gas and fuel rose 12.4 percent, perishable food 11.8 percent and non-perishable food 7.6 percent.
The ministry’s risks match the ladder: Brent crude averaged 116.8 dollars a barrel in September, 28.4 percent above August, and petroleum imports were 6.5 percent higher than a year earlier. Geopolitical tensions, Gulf conflict, volatile oil prices, trade disruptions and elevated global inflation are listed as the main downside risks, with food supplies and base effects deciding the path after October. The State Bank has already moved, raising the policy rate by 50 basis points to 12.0 percent, effective October 27, while the rupee stood at Rs276.8 to the dollar on October 28, against Rs280.97 a year earlier.
Three dates that settle the argument
First, the actual October CPI, due in early November, will show whether the 9.5 to 10.5 percent band was right. Second, NEPRA holding its Rs2.56 fuel decision for November bills will decide how much of the energy ladder reaches household electricity bills next month. Third, the State Bank’s next policy decision will show whether the hike to 12.0 percent was enough. Until then, read the two numbers as a pair: essentials are 11.32 percent dearer than a year ago, and the whole economy may still be running near 10 percent. For more business and economy news from Pakistan, follow the data, not the headline rate.